An Arrowstreet 13F position is a research lead about a systematic global equity manager, not proof of a specific fund's thesis, current holding or client exposure.
선호
Global equity opportunity sets
회피
Treating a quantitative model output as certain or free of model risk
신호 very_high (1.5조 달러 운용 자산과 5조 달러 자산관리 네트워크를 거느린 월가 최대 기관투자자 신호)
13F 이름 매칭
Morgan Stanley의 주요 주주 등재 및 대규모 지분 보유(280개 종목 커버리지)는 '해당 기업이 데니스 린치의 카운터포인트 글로벌 등 월가 최정상 액티브 성장 펀드의 고확신 지지와, 5,000억 달러 규모 파라메트릭 다이렉트 인덱싱의 마르지 않는 패시브/SMA 수급을 동시에 누리고 있는 글로벌 최상위 기관 자본의 핵심 앵커 자산'임을 증명하는 최상급 기관 신뢰도 및 수급 안정성 신호이다.
선호
구조적 시장 확장이 담보된 거대 시장(TAM)에서 독보적인 네트워크 효과를 누리는 혁신 기업
반복 매출과 AI 제품 사용은 성장 중이나, ARR 둔화·비용 상승·경쟁 및 CEO 승계를 감안하면 기본 기대는 대체로 반영된 수준이다.
동종 지위
도전자
평가 괴리
적정
턴어라운드
없음
자료 범위
4/5
시나리오 종합
시장 내러티브
시장은 Adobe가 수십 년간 쌓은 창작·문서 워크플로와 반복 구독 기반을 AI 제품으로 확장해 새로운 성장을 이어갈 것으로 기대한다. 실제로 매출은 13%, AI 우선 ARR은 150% 넘게 성장했지만 ARR 전체는 11.2%, 잔여이행의무는 8% 늘었고 순이익 증가율은 3%에 머물렀다. 이용자 도달과 AI 지표는 긍정적이나 절대 AI 매출과 수익성 기여가 공개되지 않았고, 경쟁사 성장·AI 비용·새 CEO 전환을 감안하면 기본 경로는 양호하되 기대가 사업 실적보다 앞선다고 단정할 근거도 부족해 적정으로 본다.
기본
창작 전문가와 Acrobat 구독이 성장을 이어가지만 ARR 증가율은 10%대 초반에 머물고 AI 매출 기여 공개는 제한적일 가능성이 높다. 다음 분기에서 AI ARR 절대액, RPO 증가율, 영업비용 증가율이 각각 개선되는지 확인한다.
강세
Firefly·Acrobat·Topaz 기능이 유료 상향 판매와 고객 잔존을 높이고 AI 컴퓨팅 비용이 통제되어 ARR 성장률이 가속되며, 신규 CEO가 제품 통합과 마케팅 성과를 입증한다.
약세
저가형 협업·생성형 AI 대안이 신규 사용자와 갱신을 잠식하고 외부 모델 사용료·법적 책임이 증가해 ARR 둔화와 마진 압박이 동시에 나타나며, CEO 전환이 실행 지연을 키운다.
핵심 촉매
AI 제품의 절대 ARR·갱신 성과와 신규 CEO 체제의 실행력
핵심 리스크
섹터 커버리지는 에이전트가 수집한 정성 fact·판단입니다. 투자 조언이 아니며, 출처 URL로 직접 검증하세요. raw P/E는 포함하지 않습니다.
Adobe Inc. Common Stock (ADBE) 관련 리포트
티커 관련 분석과 최신 투자 인사이트
Daily Report
2026년 2월 5일
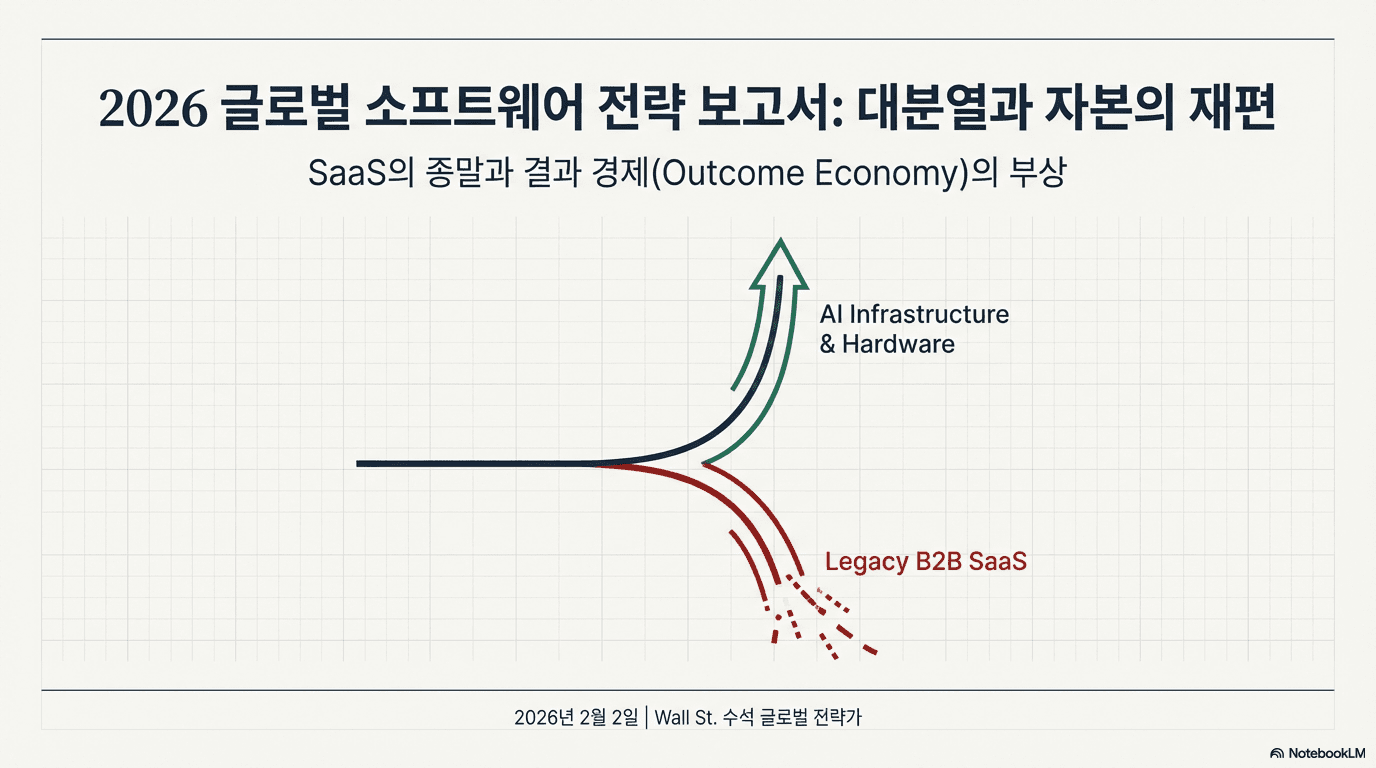
2026 글로벌 소프트웨어 전략 보고서:AI가 소프트웨어를 잠식하는가?(2026.02.05)
SaaS의 몰락인가, 세대교체인가? 2025년 강세장 속 홀로 역성장하며 닷컴 버블 이후 최대 위기를 맞은 B2B 소프트웨어 시장. AI가 정말 SaaS를 집어삼킬 것인지, 시장의 디커플링 현상과 미래 시나리오를 리포트에서 진단합니다.
#SaaS 위기
#AI 소프트웨어 잠식
#B2B 테크 투자
#2025 증시 전망
#생성형 AI 영향력
유동비율
0.77
순부채 상태이므로 상환 능력과 현금흐름을 함께 확인하세요.
현금흐름
현금 창출 양호
FCF
$9.35B
FCF 마진
36.0%
FCF 수익률
9.5%
양의 잉여현금흐름이 배당·자사주·부채상환의 재원이 됩니다.
시장 기대
중립
목표가 여력
+8.2%
의견
중립
애널리스트
32명
애널리스트 평균 목표가가 현재가 대비 +8.2% 수준입니다.
공매도 수급
과열 제한적
유동주식 대비
5.1%
전월 대비
+1.9%
커버 일수
3.2
현재 수치만 보면 공매도 쏠림은 제한적입니다.
AI 수익화보다 컴퓨팅·제품개발 비용이 먼저 증가하고 경쟁 압력이 확대될 수 있다.
Peer 대비
Adobe는 높은 구독 비중, 두 자릿수 매출 증가와 넓은 창작·문서 제품군으로 견조한 사업 기반을 보인다. 반면 ARR과 RPO 증가율은 매출보다 낮고 순이익 증가가 제한적이며, Figma의 빠른 성장·AI 비용·리더십 전환으로 성장 프리미엄을 자동 정당화하기 어렵다.
최고경영자 승계 일정
높음
실적발표/IR
아닐 차크라바르티가 2026년 12월 1일 CEO에 취임하고 샨타누 나라옌은 이사회 의장으로 이동할 예정이다.
이사회는 아닐 차크라바르티의 CEO 취임과 샨타누 나라옌의 이그제큐티브 의장 전환을 2026년 12월 1일자로 발표했다.
참고 가격은 적용 고점 기준입니다. 하락 순위·유사 사례·중단 기록은 최근 자동 분석 구간을 따르며, 가격 위치가 달라지면 최종 판정도 다시 평가합니다.
제한적 분석확정 종가 고점
확인된 결과와 자료가 부족한 부분을 함께 살펴보세요.
이번 하락
최근 확정 종가는 자동 분석 구간의 고점에 있습니다.
가격 위치
현재가 $251.67는 첫 참고 가격 $223.28 위에 있습니다. 첫 참고 가격까지 11.3%가 남아 가격만 보면 아직 그 선 이전입니다. 선에 닿기 전과 현재 판정은 함께 봅니다.
현재 판정
최근 종가가 이전 20거래일 최저치를 낮추지 않았고 30일 IV/RV 조건을 충족했고 옵션 수급 확인이 남아 현재 판정은 ‘제한적 분석’입니다. 미결제약정이나 감마가 일부 계약에서 비어 커버리지를 100%로 계산하지 못했습니다. 수급 조건은 관측이 체인 전체에서 빠짐없을 때만 판단합니다. 한 계약의 공백만으로도 보류되므로, 다른 조건이 맞아도 판정은 ‘제한적 분석’에 남습니다.
비슷한 과거
60거래일의 관측 완료 사례는 0건이며, 표본·자료 품질을 확인해야 이후 결과를 해석할 수 있습니다.
옵션과 다음 확인
30달력일 옵션 변동 규모는 ±13.2%입니다. 다음 참고선까지의 거리는 이 규모의 0.85배입니다. 배수가 1보다 작으면 비교하는 가격선이 그 변동 폭 안에 있습니다. 크기 비교이며 도달 확률은 아닙니다. 확정 종가에서 새 하락 구간이 확인되는지 살펴보고 기준과 조건을 다시 평가합니다.
확정 종가 2026-10-15$251.67 · 적용 고점 2026-10-15$251.67 · 옵션 30달력일 / 이후 60거래일
30일 IV 40.1% / 최근 20개 수익률의 RV 36.4% · 장마감 IV 관측 · RV 기준 2026-10-15 · 서로 다른 기간의 비교
풋과 콜의 변동성 차이
-8.8%p
비교한 풋의 IV가 콜보다 8.8%p 낮습니다. 이 차이만으로 보호 수요의 강도를 단정하기 어렵습니다.
계산 기준 확인
25델타 풋 IV − 콜 IV · 스큐는 상대적인 차이이며 바닥·반등 확률이 아님
가까운 만기와 먼 만기의 차이
1.7%p
가까운 만기에 더 높은 연환산 변동성이 반영돼 있습니다.
계산 기준 확인
14일 만기 − 63일 만기 · 실제 기간의 움직임 폭은 기간 선택에서 확인
옵션 변동 폭과 중단 참고선의 의미
현재 옵션 가격에 반영된 30달력일의 움직임 규모를 위·아래 13.2%로 환산했습니다. 표시 범위 밖으로도 움직일 수 있습니다. 하락 구간이 확인된 뒤 기준 당시의 풋 수급 자료로 정합니다.
중단 기준 자료 미확인
유사한 상태 이후에는 어땠나
60거래일의 관측 완료 사례는 0건이며, 표본·자료 품질을 확인해야 이후 결과를 해석할 수 있습니다.
관측 완료 5건 이상과 유효한 이력이 필요합니다. 기간별 완료 사례 집합은 다를 수 있습니다.
가격선 계산의 종료 구간 200개와 이 결과의 관측 완료 0건은 서로 다른 표본입니다. 비교 사례가 적어 몇 사례만 달라져도 결과가 크게 바뀔 수 있습니다. 관측 미완료 0건 · 관측 겹침 0건 · 겹치지 않는 기간 묶음 0개.
표본 선정과 결과의 의미
이번 하락 구간이 아직 확정되지 않아 확정 하락 구간의 이후 결과와 비교를 보류합니다. 기간 끝의 수익률이 높아도 중간에 더 내려갈 수 있습니다. 두 중앙값은 서로 다른 사례에서 나올 수 있어 하나의 실제 경로로 이어 읽지 않습니다. 기간별 완료 집합이 다르므로 서로 다른 기간의 중앙값을 하나의 회복 경로로 이어 읽지 않습니다.
과거 하락 구간 비교계산 방법과 자료 상태
가격
2026-10-15 · 사용 가능
확정 일봉
2026-10-15 · 사용 가능
IV
2026-10-15 · 사용 가능
옵션 수급
2026. 10. 16. 10:26 · 사용 가능
조정종가
2026-10-15 · 사용 가능
장마감 IV 관측 9일 / 순위 통계에 필요 20일입니다. IV 순위는 표시하지 않으며 현재 IV/RV 비교는 별도로 평가합니다.
유효 감마·OI 커버리지가 완전하지 않아 순 GEX의 부호 판정을 보류합니다.
정확히 5거래일 전의 같은 방식 IV가 없어 IV 변화 비교를 보류합니다.
공매도 잔고가 전월 대비 1.9% 늘었습니다.
2026-10-15 확정 반등으로 이전 하락 구간이 종료되어 기준이 변경되었습니다. 이전 고점 291.52 → 전환일 고점 251.67 (현재 주가 단위).
이후 결과는 당시 확인된 깊이의 ±20%(최소 ±1.5%p), 기간의 0.65~1.5배, 누적 부담의 0.6~1.6배에 처음 들어온 시점을 구간당 한 번 비교합니다. 미래의 저점이나 최종 면적으로 사례를 고르지 않습니다. 옵션 변동 폭은 총분산을 보간하며 외삽하지 않습니다.
옵션 내재변동성 (IV)
40.1%
30달력일 일정 만기 콜 ATM IV입니다. 양쪽 만기의 총분산을 보간하며 외삽하지 않습니다.
관측 기간 내 IV 위치
—
최근 최대 63회 중 9회 비교 · 20회 미만은 순위 표시 보류. 높은 순위만으로 저평가나 반등을 판단하지 않습니다.
옵션 내재변동성 추이
2026-09-03 ~ 2026-10-15 · 9회 관측 · 최근 값 40.1%
날짜별 IV 값 보기
관측 날짜별 옵션 내재변동성
관측일
IV
2026-10-15
40.1%
2026-10-05
41.7%
2026-09-28
43.3%
2026-09-22
43.8%
2026-09-18
41.3%
2026-09-15
47.2%
2026-09-09
56.4%
2026-09-04
54.8%
2026-09-03
52.1%
가격과 시장 자료에 따른 참고 분석입니다. 기업 가치·재무·뉴스와 개인의 투자 기간을 함께 확인하세요. 가격선은 주문이나 배분 비중을 정하지 않습니다.